Data & analytics consulting · Chicago, IL
Turn your data into decisions.
One source of truth. Reporting that runs itself. Dashboards your executives actually open.
Trusted by finance & operations teams at 40+ mid-market and enterprise companies.
Trusted by teams at
- Meridian Freight
- Averro Foods
- Northgate Supply
- Halstead Health
- Ferrum Manufacturing
- Bluepeak Logistics
- Corvid Financial
- Quill & Co.
Why reporting hurts
Your numbers exist. You just can't see them.
- 01
Data trapped in spreadsheets
Fourteen tools, forty exports, one analyst gluing it together in Excel. Every version is someone's version.
- 02
Reporting eats your week
Days of copy-paste to produce a board pack that's already aging by the time it's presented.
- 03
Decisions on stale numbers
Last month's actuals steering this month's calls — and nobody's sure which figure is right.
What we build
Five capabilities. One clear line of sight.
Scoped to what your operation needs, built on your existing systems, handed over documented.
Executive Reporting
Board packs and monthly reporting that assemble themselves — accurate, on time, automatic.
- Automated board packs
- Scheduled delivery
- Variance commentary
Budgeting & Forecasting
Driver-based budgets and rolling forecasts your team can update in hours, not weeks.
- Driver-based models
- Rolling forecasts
- Scenario planning
Data Consolidation
Every source — ERP, CRM, billing, spreadsheets — flowing into one governed warehouse.
- Warehouse build
- Automated pipelines
- Single source of truth
Financial & Operational Analysis
Margin, cost, and capacity questions answered with numbers that trace to their source.
- Margin & cost analysis
- KPI definitions
- Ad-hoc deep dives
Data Visualization
Executive dashboards designed to be read in seconds and trusted at a glance.
- Executive dashboards
- Self-serve views
- Alerting on thresholds
The deliverable
Dashboards your Monday meeting runs on.
Live, drillable, and current as of this morning — this is what replaces the spreadsheet pack.
- Revenue vs. plan
- +4.2%
- Forecast accuracy
- 94%
- Faster month-end close
- 3 days
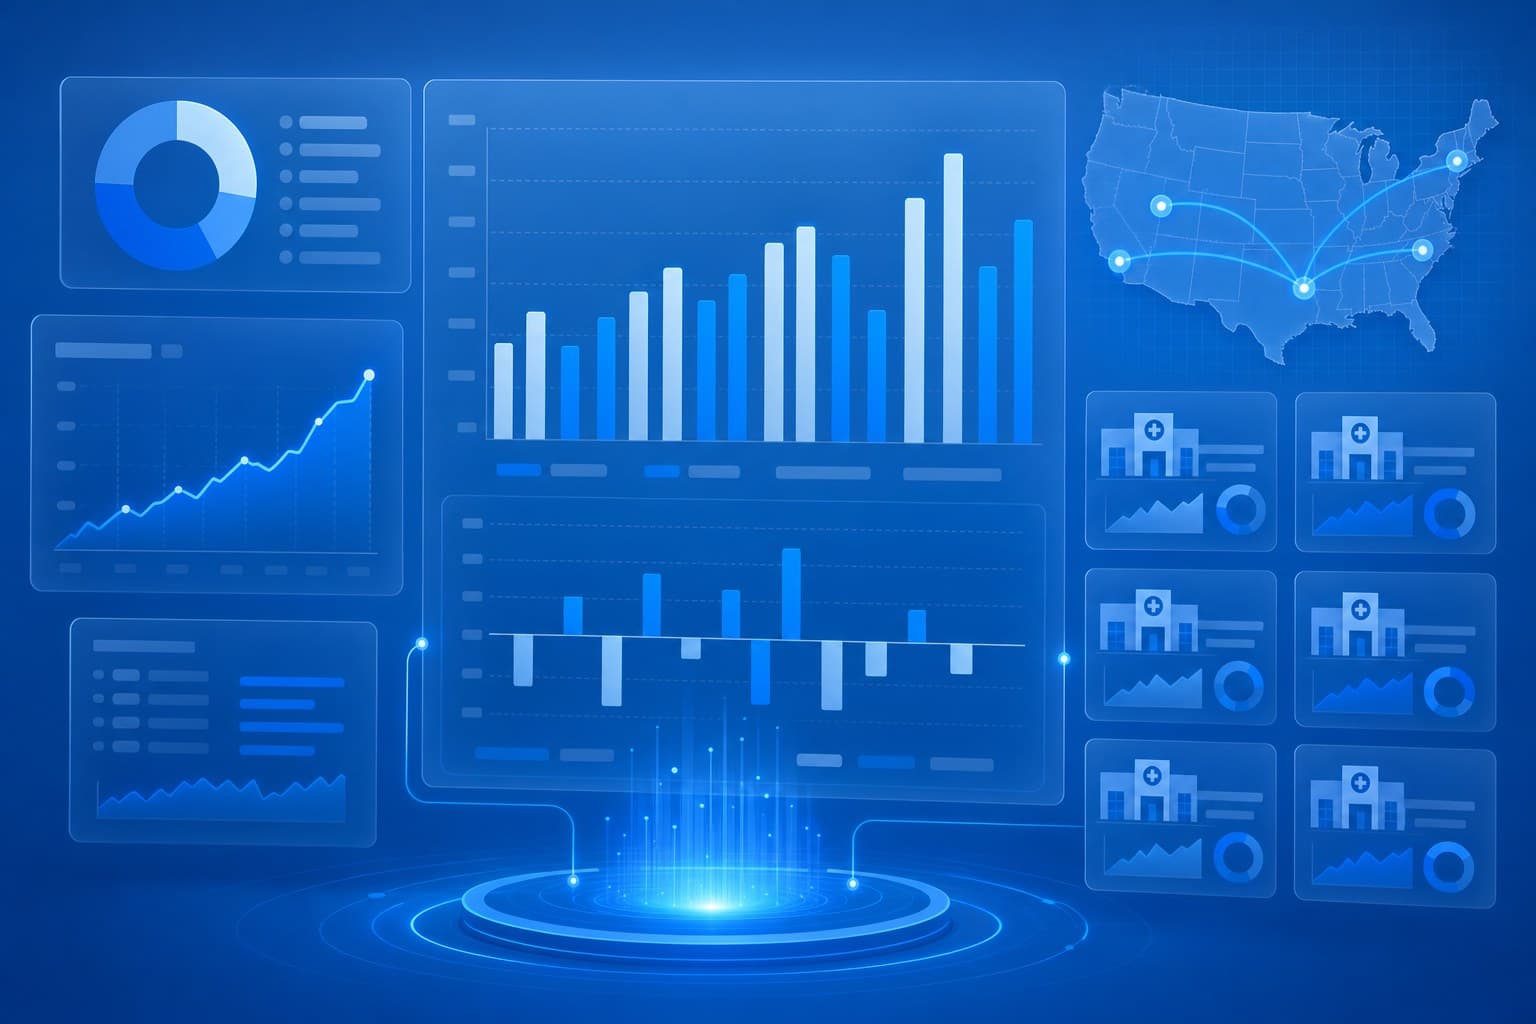
A representative Sightline executive dashboard — every figure traces to a governed source.
How it works
Connect. Centralize. Analyze.
Three phases from scattered systems to decisions on live data — most teams see their first dashboard inside six weeks.
- 01
Connect
We plug into every source you run on — ERP, CRM, billing, spreadsheets — without disrupting any of them.
- 02
Centralize
Data lands in one governed warehouse with agreed definitions. One number, one meaning, everywhere.
- 03
Analyze
Dashboards, forecasts, and automated reporting go live — and your team is trained to own them.
The numbers on us
What clients measure after Sightline.
- Dashboards & reporting systems delivered
- 140+
- Average reporting time saved, per team, per week
- 30 hrs
- Net promoter score across active clients
- 72
- Average client tenure with Sightline
- 4.6 yrs
Figures are representative of Sightline engagements.
Recent engagements
From spreadsheet chaos to a single sightline.

National logistics · 1,200 employees
3 days → 40 min
Weekly reporting cycle
Meridian Freight
Fourteen data sources consolidated into one warehouse; the Monday ops pack now builds itself overnight.
Multi-site healthcare · 30 clinics
$1.2M
Cost variance surfaced in year one
Halstead Health
Driver-based budgeting across 30 sites cut the planning cycle by 38% and exposed spend no one could see.

Industrial manufacturing · 4 plants
+22%
Forecast accuracy
Ferrum Manufacturing
Live capacity and margin dashboards replaced month-old reports — production planning now runs a week ahead.
What clients say
The argument about whose number is right — gone.
We stopped debating whose spreadsheet was correct and started debating what to do next. That shift alone paid for the engagement.
Dana WhitfieldCFO, Meridian Freight
Sightline gave every clinic director the same numbers on the same morning. Our monthly review went from archaeology to strategy.
Sam OkaforVP of Operations, Halstead Health
They didn't sell us software. They built the reporting layer we'd been promising ourselves for five years — in one quarter.
Ruth CallowayCEO, Ferrum Manufacturing
The team
Analysts first. Consultants second.

Adrian Voss
Founder & Principal
Adrian spent twelve years inside mid-market finance teams — the person rebuilding the board pack at midnight and wondering why the numbers never matched.
He founded Sightline to fix that at the root: one governed source of truth, reporting that runs itself, and dashboards leaders actually trust.
Every engagement is scoped and led by a principal — never handed down.
Priya Raman
Head of Data Engineering
Pipelines, warehousing, and the governance that keeps one number meaning one thing.
Marcus Bell
Analytics Lead
Forecast models and executive dashboards designed to be read in seconds.
Free template kit
The Executive Dashboard Blueprint Kit
Build the dashboard your leadership team actually reads.
Most executive dashboards drown the signal in forty metrics nobody acts on. This kit strips reporting down to the five numbers that move the business — revenue quality, margin trajectory, cash runway, pipeline velocity, and retention — laid out the way a board wants to read them.
What's inside
- The Five-Number Board View — a one-screen executive summary template
- Revenue & margin trend sheet with plan-vs-actual bands
- Cash-runway and burn tracker with a 13-week horizon
- Pipeline-velocity model — coverage, conversion, and cycle time
- A KPI dictionary so every number means one thing across the team
Get started
Book a data assessment.
Bring your current reporting pack. In 45 minutes you'll see where the hours are going and which numbers to trust — useful whether or not we work together.